Decision
The peer is read through this container's API, not from the browser.
/api/admin/peer fetches the peer's /api/admin/metrics server side and
returns it. That keeps CORS closed on both origins and keeps the peer's address
out of the client bundle: one configuration value per container, Peer:Url,
holds the peer's public origin, which is a URL and not a credential, and the
browser only ever learns the peer's host name.
public sealed class PeerReader(string? configuredUrl, Outbound client, bool bothStoresHere = false)
{
public const string OneProcess =
"no peer to read: since 19 October both sites are this one process, so the comparison card above sets the two stores side by side";
public static readonly TimeSpan Patience = TimeSpan.FromSeconds(2.5);
public Uri? Url { get; } =
string.IsNullOrWhiteSpace(configuredUrl) || configuredUrl.StartsWith("__", StringComparison.Ordinal)
? null
: Uri.TryCreate(configuredUrl.TrimEnd('/'), UriKind.Absolute, out var url) ? url : null;
public async Task<PeerView> ReadAsync(CancellationToken cancellation)
{
if (Url is null)
{
return new PeerView(false, false, bothStoresHere ? OneProcess : "no peer is configured on this container", null, DateTimeOffset.UtcNow, null, null);
}
string host = Url.Host;
try
{
using var timeout = CancellationTokenSource.CreateLinkedTokenSource(cancellation);
timeout.CancelAfter(Patience);
using var response = await client.GetAsync(new Uri(Url, "/api/admin/metrics"), timeout.Token);
if (!response.IsSuccessStatusCode)
{
return new PeerView(true, false, $"the peer answered {(int)response.StatusCode}", host, DateTimeOffset.UtcNow, null, null);
}
var metrics = await response.Content.ReadFromJsonAsync<JsonElement>(cancellationToken: timeout.Token);
string? version = await VersionAsync(timeout.Token);
return new PeerView(true, true, null, host, DateTimeOffset.UtcNow, metrics, version);
}
catch (OperationCanceledException)
{
return new PeerView(true, false, $"the peer did not answer within {Patience.TotalSeconds:0.#} seconds", host, DateTimeOffset.UtcNow, null, null);
}
catch (Exception ex) when (ex is HttpRequestException or JsonException or InvalidOperationException)
{
return new PeerView(true, false, $"the peer could not be read ({ex.GetType().Name})", host, DateTimeOffset.UtcNow, null, null);
}
}
private async Task<string?> VersionAsync(CancellationToken token)
{
try
{
using var response = await client.GetAsync(new Uri(Url!, "/api/version"), token);
if (!response.IsSuccessStatusCode)
{
return null;
}
var body = await response.Content.ReadFromJsonAsync<JsonElement>(cancellationToken: token);
return body.TryGetProperty("version", out var version) && version.ValueKind == JsonValueKind.String
? version.GetString()
: null;
}
catch (Exception ex) when (ex is HttpRequestException or JsonException or InvalidOperationException or OperationCanceledException)
{
return null;
}
}
}
public sealed record PeerView(bool Configured, bool Reachable, string? Reason, string? Host, DateTimeOffset FetchedAt, JsonElement? Metrics, string? Version)
{
public string Title => !Configured ? "No peer is configured on this container"
: !Reachable ? "The other site is not answering"
: $"The other site ({StoreOf(Metrics) ?? "store unknown"})";
private static string? StoreOf(JsonElement? metrics) =>
metrics is { ValueKind: JsonValueKind.Object } m && m.TryGetProperty("store", out var store) && store.ValueKind == JsonValueKind.Object
&& store.TryGetProperty("store", out var name) && name.ValueKind == JsonValueKind.String
? name.GetString()
: null;
}
Live from api/TheYard.Api/Shared/Instance/Peer.cs, region peer, read from this build at 8003063.
The peer is a thing that can be down. ADR: The relational store established
that the site comes up when the database does not, and the same rule holds
here: no peer configured, no answer, a slow answer and a wrong answer are four
different sentences on the card, and none of them is an exception. Two and a
half seconds of patience, not a hang, because the card refreshes every thirty
seconds and a peer that takes longer than that is down for the purposes of a
comparison. The rest of the Admin tab renders whatever the peer says.
The tests were written in the order the record asks for, the failures first:
[Fact]
public async Task With_no_peer_configured_the_endpoint_says_so_and_the_rest_of_admin_is_untouched()
{
await using var api = Api(null);
var client = api.CreateClient();
var peer = await client.GetFromJsonAsync<JsonElement>("/api/admin/peer");
Assert.False(peer.GetProperty("configured").GetBoolean());
Assert.False(peer.GetProperty("reachable").GetBoolean());
Assert.Contains("no peer", peer.GetProperty("reason").GetString());
var health = await client.GetAsync("/api/health");
Assert.Equal(HttpStatusCode.OK, health.StatusCode);
}
[Fact]
public async Task A_placeholder_the_deploy_left_behind_is_no_peer()
{
await using var api = Api("__PEER_URL__");
var peer = await api.CreateClient().GetFromJsonAsync<JsonElement>("/api/admin/peer");
Assert.False(peer.GetProperty("configured").GetBoolean());
}
[Fact]
public async Task An_unreachable_peer_is_a_sentence_within_the_patience_not_a_hang()
{
await using var api = Api("http://127.0.0.1:9");
var client = api.CreateClient();
var clock = Stopwatch.StartNew();
var peer = await client.GetFromJsonAsync<JsonElement>("/api/admin/peer");
clock.Stop();
Assert.True(peer.GetProperty("configured").GetBoolean());
Assert.False(peer.GetProperty("reachable").GetBoolean());
Assert.False(string.IsNullOrWhiteSpace(peer.GetProperty("reason").GetString()));
Assert.True(clock.Elapsed < PeerReader.Patience + TimeSpan.FromSeconds(8), $"took {clock.Elapsed}");
Assert.DoesNotContain("127.0.0.1:9", peer.GetProperty("reason").GetString());
}
[Fact]
public async Task A_peer_that_answers_slowly_is_reported_as_slow_and_nothing_waits_for_it()
{
using var slow = new CannedPeer(delay: TimeSpan.FromSeconds(20));
await using var api = Api(slow.Origin);
var client = api.CreateClient();
var clock = Stopwatch.StartNew();
var peer = await client.GetFromJsonAsync<JsonElement>("/api/admin/peer");
clock.Stop();
Assert.False(peer.GetProperty("reachable").GetBoolean());
Assert.Contains("did not answer", peer.GetProperty("reason").GetString());
Assert.True(clock.Elapsed < TimeSpan.FromSeconds(15), $"took {clock.Elapsed}");
}
Live from api/TheYard.Tests/PeerTests.cs, region peer-down, read from this build at 8003063.
and the happy path last, against a canned peer on the loopback:
[Fact]
public async Task A_peer_that_answers_is_relayed_whole_with_its_host_and_nothing_else_about_its_address()
{
using var canned = new CannedPeer(delay: TimeSpan.Zero);
await using var api = Api(canned.Origin);
var peer = await api.CreateClient().GetFromJsonAsync<JsonElement>("/api/admin/peer");
Assert.True(peer.GetProperty("reachable").GetBoolean());
Assert.Equal("127.0.0.1", peer.GetProperty("host").GetString());
Assert.Equal("Azure Cosmos DB", peer.GetProperty("metrics").GetProperty("store").GetProperty("store").GetString());
Assert.Equal("1.0.3.999", peer.GetProperty("version").GetString());
Assert.Equal(2, canned.Hits);
}
Live from api/TheYard.Tests/PeerTests.cs, region peer-up, read from this build at 8003063.
The rows are routes, not paths. A bid on one vehicle and a bid on another
are the same operation, and a card that listed a hundred thousand paths would
say nothing. Timing is grouped by route template, with the identifiers taken
out, and the store log's operations are grouped the same way so the document
column can say what a route costs in request units as well as milliseconds:
public static partial class Routes
{
[GeneratedRegex("^/api/vehicles/[^/]+")]
private static partial Regex VehicleId();
[GeneratedRegex("^/api/docs/diagrams/[^/]+")]
private static partial Regex DiagramName();
[GeneratedRegex("^/api/docs/[^/]+")]
private static partial Regex DocSlug();
[GeneratedRegex("^/api/images/.+")]
private static partial Regex ImageFile();
public static string TemplateOf(string path)
{
string template = VehicleId().Replace(path, "/api/vehicles/{id}");
template = DiagramName().Replace(template, "/api/docs/diagrams/{name}");
if (!template.StartsWith("/api/docs/diagrams/", StringComparison.Ordinal))
{
template = DocSlug().Replace(template, "/api/docs/{slug}");
}
return ImageFile().Replace(template, "/api/images/{file}");
}
public static string Of(string method, string path) => $"{method} {TemplateOf(path)}";
public static IReadOnlyList<RouteTiming> ByRoute(IReadOnlyList<RequestEntry> requests) =>
requests
.GroupBy(entry => Of(entry.Method, entry.Path), StringComparer.Ordinal)
.Select(group =>
{
long[] durations = group.Select(entry => entry.DurationMs).ToArray();
return new RouteTiming(group.Key, durations.Length, Percentiles.Of(durations, 50), Percentiles.Of(durations, 95), durations.Max());
})
.OrderByDescending(timing => timing.Count)
.ThenBy(timing => timing.Route, StringComparer.Ordinal)
.ToArray();
public static IReadOnlyList<RouteCharge> ChargesByRoute(IReadOnlyList<StoreOperation> operations) =>
operations
.Where(operation => operation.Request is not null)
.GroupBy(operation => (operation.RequestId ?? operation.Request!, operation.Request!))
.Select(perRequest =>
{
var parts = perRequest.Key.Item2.Split(' ', 2);
string route = parts.Length == 2 ? Of(parts[0], parts[1]) : perRequest.Key.Item2;
return (Route: route, Operations: perRequest.Count(), Charge: perRequest.Sum(operation => operation.RequestCharge), CrossPartition: perRequest.Count(o => o.Partition.StartsWith("cross", StringComparison.Ordinal)));
})
.GroupBy(sample => sample.Route, StringComparer.Ordinal)
.Select(group =>
{
double[] charges = group.Select(sample => sample.Charge).OrderBy(charge => charge).ToArray();
return new RouteCharge(
group.Key,
group.Count(),
Math.Round(group.Select(sample => (double)sample.Operations).Average(), 1),
Math.Round(charges[(int)Math.Ceiling(charges.Length * 0.5) - 1], 2),
Math.Round(charges[^1], 2),
group.Sum(sample => sample.CrossPartition));
})
.OrderByDescending(charge => charge.Requests)
.ThenBy(charge => charge.Route, StringComparer.Ordinal)
.ToArray();
}
public sealed record RouteTiming(string Route, int Count, long P50Ms, long P95Ms, long MaxMs);
public sealed record RouteCharge(string Route, int Requests, double OperationsPerRequest, double RuP50, double RuMax, int CrossPartition);
Live from api/TheYard.Api/Shared/Instance/Peer.cs, region routes, read from this build at 8003063.
The request-unit figure per route is exact per request: every operation the
store log records carries the trace identifier ASP.NET Core gives the request
that caused it, so twenty sign-ins are twenty samples of 2 RU and not one sum
of 40. The first version of this card grouped by method and path instead and
reported twenty sign-ins as a single 34 RU request, which the first
measurement session caught (ADR: Measuring both stores).
Cold start is measured on each container, at its own start. How long the
store took to answer, how long the catalogue and the bids took to load, and
when the container was ready to serve, all counted from the process's own
start time and exposed in the metrics, so the two columns compare two real
cold starts rather than one stopwatch and one memory:
public sealed class StartupTimings
{
private readonly DateTime _processStart = System.Diagnostics.Process.GetCurrentProcess().StartTime.ToUniversalTime();
private readonly Dictionary<string, long> _steps = new(StringComparer.Ordinal);
public long? ReadyMs { get; private set; }
public async Task<T> Time<T>(string step, Func<CancellationToken, Task<T>> work, CancellationToken cancellation)
{
var clock = System.Diagnostics.Stopwatch.StartNew();
var result = await work(cancellation);
_steps[step] = clock.ElapsedMilliseconds;
return result;
}
public async Task Time(string step, Func<CancellationToken, Task> work, CancellationToken cancellation)
{
var clock = System.Diagnostics.Stopwatch.StartNew();
await work(cancellation);
_steps[step] = clock.ElapsedMilliseconds;
}
public void Ready() => ReadyMs = (long)(DateTime.UtcNow - _processStart).TotalMilliseconds;
public long? Ms(string step) => _steps.TryGetValue(step, out long ms) ? ms : null;
}
Live from api/TheYard.Api/Shared/Observability/AdminObservability.cs, region startup-timings, read from this build at 8003063.
The card. Two columns, this container first, the peer second, on rows for
the store, the cold start, the store check, the seed with its charge, the
catalogue and bid loads, the requests window, the seven routes a visitor
actually takes, and the store operations window:
const COMPARED_ROUTES: { route: string; label: string }[] = [
{ route: 'GET /api/vehicles', label: 'Listing page' },
{ route: 'GET /api/vehicles/{id}', label: 'Vehicle page' },
{ route: 'GET /api/facets', label: 'Filter values' },
{ route: 'POST /api/vehicles/{id}/bids', label: 'Bid write' },
{ route: 'POST /api/auth/login', label: 'Sign in' },
{ route: 'POST /api/auth/register', label: 'Register' },
{ route: 'POST /api/market/tick', label: 'Room tick' },
];
type StoreColumn = {
title: string;
store: string;
startup: Startup;
requests: {
window: number;
p50_ms: number | null;
p95_ms: number | null;
by_route: RouteTiming[];
};
charges: RouteCharge[];
storeOps: string;
};
function storeOpsLine(store: StoreSummary | null, sql: SqlSummary | null): string {
if (store !== null) {
return `${percentileWords(store.p50_ms, store.p95_ms, 'no operations yet')}, ${store.ru_total} RU over ${store.window}, ${store.cross_partition} cross-partition`;
}
if (sql !== null) {
return `${percentileWords(sql.p50_ms, sql.p95_ms, 'no statements yet')} over ${sql.window} statements`;
}
return '';
}
function columnOf(title: string, m: Metrics): StoreColumn {
const cosmos = m.store.store === 'Azure Cosmos DB';
return {
title,
store: m.store.store,
startup: m.startup,
requests: m.requests,
charges: cosmos ? m.store_by_route : [],
storeOps: storeOpsLine(cosmos ? m.store : null, cosmos ? null : m.sql),
};
}
function columnOfBackend(backend: BackendMetrics, current: boolean): StoreColumn {
return {
title: current ? `${backend.store}, serving this visit` : backend.store,
store: backend.store,
startup: backend.startup,
requests: backend.requests,
charges: backend.store_by_route,
storeOps: storeOpsLine(backend.store_metrics, backend.sql),
};
}
function columns(
mine: Metrics,
peer: Peer | null
): { columns: StoreColumn[]; note: string | null } {
const backends = mine.backends ?? [];
if (backends.length > 1) {
const current = backends.find((b) => b.store === mine.store.store) ?? backends[0];
const ordered = [current, ...backends.filter((b) => b !== current)];
return {
columns: ordered.map((b) => columnOfBackend(b, b === current)),
note: 'Both stores run in this container, so the two columns share a process, a region and a request ring; only the store differs.',
};
}
const theirs = peer !== null && peer.reachable ? peer.metrics : null;
const peerTitle = peer === null ? 'The peer could not be read' : peer.title;
const peerNote = peer !== null && peer.configured && !peer.reachable ? peer.reason : null;
const empty: StoreColumn = {
title: peerTitle,
store: '',
startup: {
...mine.startup,
ready_ms: null,
schema_ms: 0,
seed_ms: 0,
seed_ru: null,
catalogue_ms: null,
bids_ms: null,
},
requests: { window: 0, p50_ms: null, p95_ms: null, by_route: [] },
charges: [],
storeOps: '',
};
return {
columns: [
columnOf(`This site (${mine.store.store})`, mine),
theirs === null ? empty : columnOf(peerTitle, theirs),
],
note: peerNote,
};
}
type ComparedRow = { label: string; cells: (column: StoreColumn) => string };
function Comparison({ mine, peer }: { mine: Metrics; peer: Peer | null }) {
const { columns: cols, note } = columns(mine, peer);
const blank = (column: StoreColumn) => column.store === '';
const routeCell = (column: StoreColumn, route: string): string => {
if (blank(column)) return '';
const timing = column.requests.by_route.find((r) => r.route === route);
if (timing === undefined) return 'not seen yet';
const charge = column.charges.find((r) => r.route === route);
const time = `${percentileWords(timing.p50_ms, timing.p95_ms)} (${timing.count})`;
return charge === undefined ? time : `${time} · ${charge.ru_p50} RU`;
};
const rows: ComparedRow[] = [
{ label: 'Store', cells: (c) => c.store },
{
label: 'Cold start, process start to ready',
cells: (c) => (blank(c) ? '' : ms(c.startup.ready_ms)),
},
{
label: 'Store check (schema or containers)',
cells: (c) => (blank(c) ? '' : ms(c.startup.schema_ms)),
},
{
label: 'Seed, first boot only',
cells: (c) => (blank(c) ? '' : msAndRu(c.startup.seed_ms, c.startup.seed_ru)),
},
{ label: 'Catalogue load', cells: (c) => (blank(c) ? '' : ms(c.startup.catalogue_ms)) },
{ label: 'Bids load', cells: (c) => (blank(c) ? '' : ms(c.startup.bids_ms)) },
{
label: 'Requests, all paths',
cells: (c) =>
blank(c)
? ''
: `${percentileWords(c.requests.p50_ms, c.requests.p95_ms)} (${c.requests.window})`,
},
...COMPARED_ROUTES.map((entry) => ({
label: entry.label,
cells: (c: StoreColumn) => routeCell(c, entry.route),
})),
{ label: 'Store operations, this window', cells: (c) => c.storeOps },
];
return (
<DataTable
label="Backends side by side"
rows={rows}
rowKey={(row) => row.label}
columns={[
{ name: 'Measured', cell: (row) => row.label },
...cols.map((column): Column<ComparedRow> => ({
name: column.title,
mono: true,
cell: (row) => row.cells(column),
})),
]}
note={note === null ? undefined : { content: note, testId: 'peer-note' }}
/>
);
}
/** This site's build beside the other site's, the first thing to rule out when two columns differ. */
function versionsLine(own: string | null, peer: Peer | null): string {
const mine = own === null ? 'this site: version not read' : `This site runs v${own}`;
if (peer === null || !peer.configured) return `${mine}; no other site to compare.`;
if (!peer.reachable || peer.version === undefined || peer.version === null) {
return `${mine}; the other site's version could not be read.`;
}
return `${mine}; the other site runs v${peer.version}${own === peer.version ? ', the same build' : ''}.`;
}
/** The process under both columns: when it started, and how much it compiled for itself. */
function runtimeLine(m: Metrics): string {
const started = `This process started ${clockLabel(m.startup.started_at)}`;
const prepared = m.startup.prepare_ms === null ? '' : `, prepared in ${ms(m.startup.prepare_ms)}`;
if (m.runtime === undefined) return `${started}${prepared}.`;
const r = m.runtime;
return `${started}${prepared}; the runtime compiled ${r.jit_methods.toLocaleString('en-US')} methods itself in ${ms(r.jit_ms)}, ${r.gc} garbage collection${r.gc_concurrent ? ', concurrent' : ''}, ${r.processors} processor${r.processors === 1 ? '' : 's'}.`;
}
Live from src/components/admin/BackendsCard/BackendsCard.tsx, region comparison, read from this build at 8003063.
Addendum, 2026-09-09: parity, every number for both stores
The morning after both stores went into every container, Steve asked for the
Admin tab to show every figure for Cosmos DB that it shows for SQL Server.
The Admin tab was inventoried card by card on both sites before
anything changed, from the page's source and from each site's own answers
to the endpoints behind it, and each number marked as belonging to one
store, to both, or to the container:
- Backends, side by side: both, by construction; the columns are the
backends, and the store-operations row already put the relational window
and the document window on the same row.
- Same performance, proven: both, by construction.
- The partition key, live: the document store's alone, and it stays so;
the ask is that the relational store never has a statistic the document
store lacks, not the other way round.
- Application health: both, one check per store with its duration.
- Azure's view of the container, Traffic, last hour, Recent
errors: the container's, not a store's.
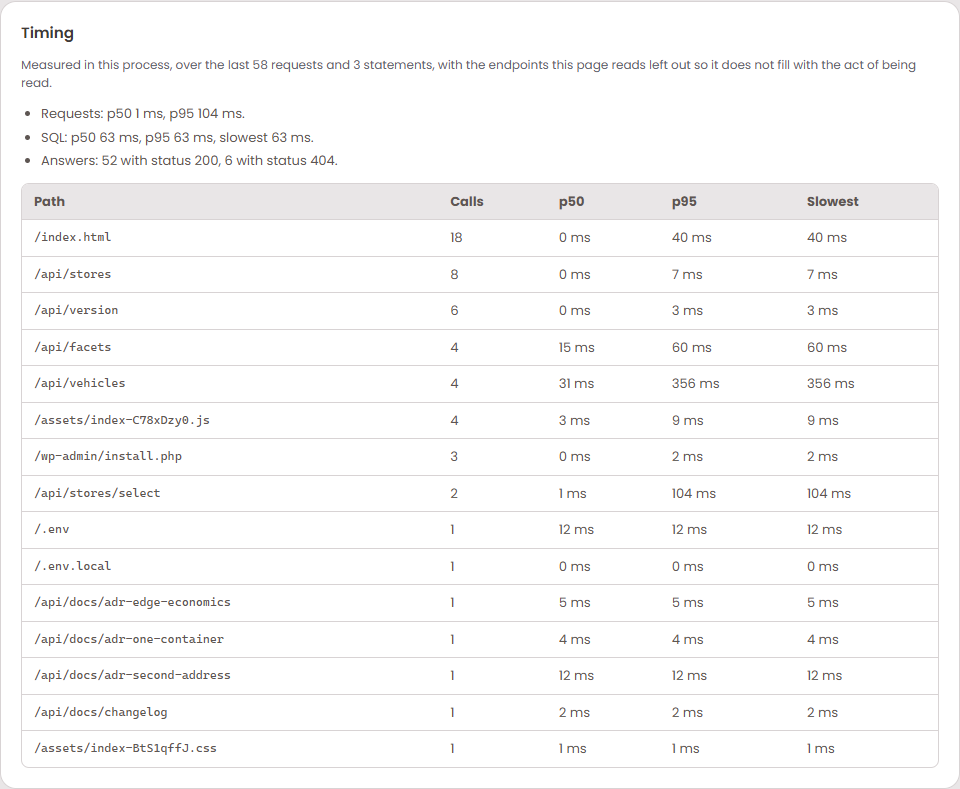
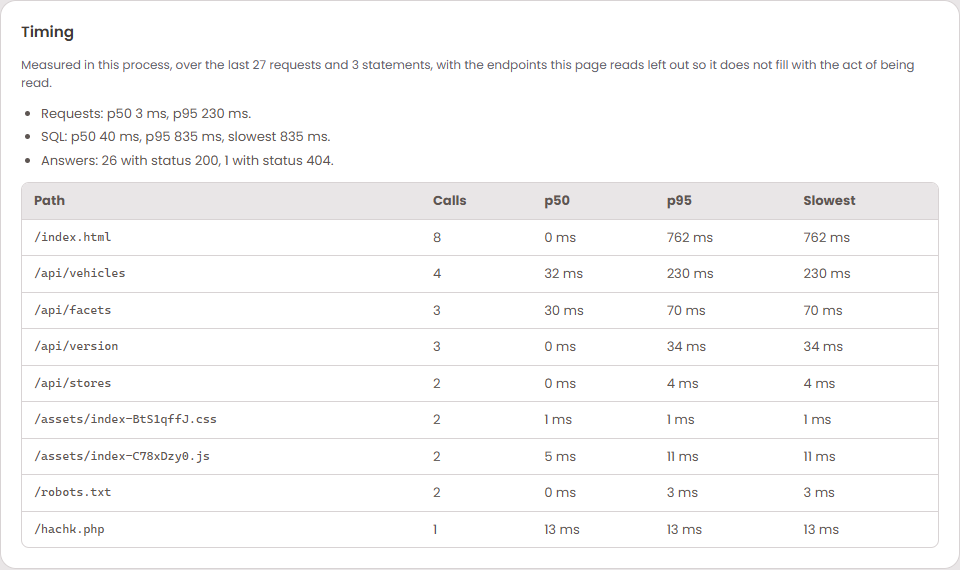
- Timing: the relational store's alone. The card said "SQL: p50, p95,
slowest" from the SQL ring, and on the site whose default store is the
document one that line was about the other store while the store serving
the visit got nothing. The window sentence named the request ring and the
SQL ring and not the store ring. This was the gap.
- The SQL this application ran and What the document store ran:
both, on both sites. The document store's card was already drawn whenever
the container had a document store, whichever store served the visit; its
rule compared the log's label to a name, and the SQL card's rule read the
backends list, so the two rules were the same rule written two ways.
- The page's opening paragraph described the SQL statements and the log and
did not mention the operations at all.
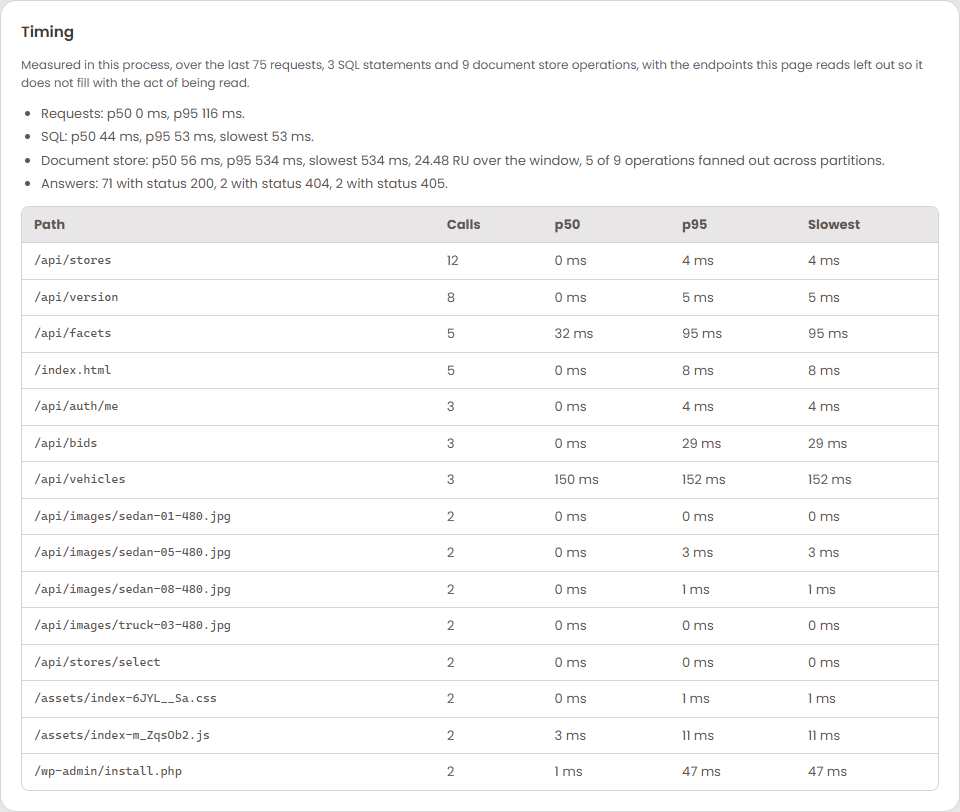
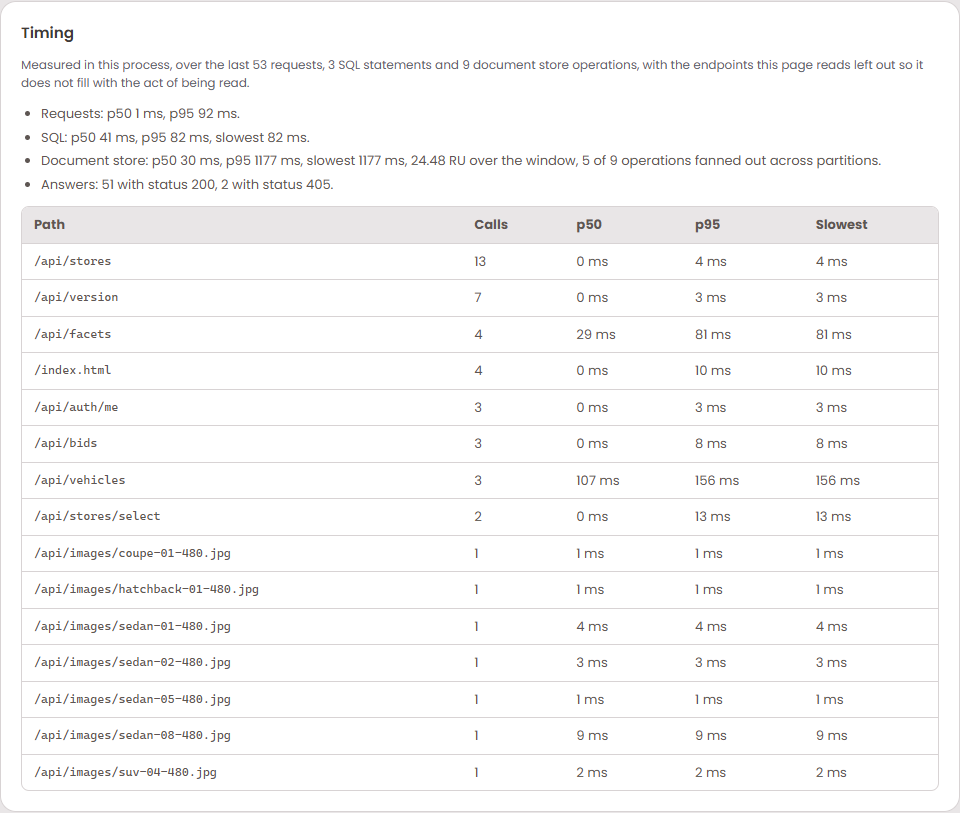
What changed. The Timing card has a document store line under the SQL line,
with the same three numbers and the two only that store can put a figure on:
the request units the window cost, and how many of its operations fanned out
across partitions rather than reading one. Its window sentence names all
three rings. On a container with no document store, a developer's machine
or CI, the line says so in words rather than going missing, which is the
standard the comparison card already held. The words are arithmetic in
src/lib/metrics.ts, read from the backend that has a document store and not
from the top-level block, whose label is the store serving the visit while
its numbers are always the document ring's; a peer on an older build with no
backends list falls back on the label. The document store card's rule reads
the same backends list the SQL card's does, with the label as the fallback.
The opening paragraph names both logs and states the standard.
export function documentStore(metrics: TimingMetrics): StoreWindow | null {
if (metrics.backends !== undefined) {
const backend = metrics.backends.find((candidate) => candidate.store_metrics !== null);
return backend?.store_metrics ?? null;
}
return metrics.store.store === 'Azure Cosmos DB' ? metrics.store : null;
}
export function timingWindow(metrics: TimingMetrics): string {
const store = documentStore(metrics);
const rings = [
`${metrics.requests.window} requests`,
`${metrics.sql.window} SQL statements`,
store === null
? 'no document store on this container'
: `${store.window} document store operations`,
];
return `Measured in this process, over the last ${rings[0]}, ${rings[1]} and ${rings[2]}, with the endpoints this page reads left out so it does not fill with the act of being read.`;
}
export function sqlLine(metrics: TimingMetrics): string {
const sql = metrics.sql;
if (sql.p50_ms === null || sql.p95_ms === null) {
return 'SQL: no statements in the ring yet, so there is nothing to time.';
}
return `SQL: ${percentileWords(sql.p50_ms, sql.p95_ms)}, slowest ${timingWords(sql.max_ms, 'none')}.`;
}
export function documentStoreLine(metrics: TimingMetrics): string {
const store = documentStore(metrics);
if (store === null) {
return 'Document store: none on this container, so there is no operation to time.';
}
const fanned =
store.window === 0
? 'no operations yet'
: `${store.cross_partition} of ${store.window} operations fanned out across partitions`;
const timing =
store.p50_ms === null || store.p95_ms === null
? 'nothing to time'
: `${percentileWords(store.p50_ms, store.p95_ms)}, slowest ${timingWords(store.max_ms, 'none')}`;
return `Document store: ${timing}, ${store.ru_total} RU over the window, ${fanned}.`;
}
Live from src/lib/metrics.ts, region document-store-window, read from this build at 8003063.
What holds it: src/lib/metrics.test.ts for the words, including the
container with no document store and the quiet window;
AdminObservabilityTests for the shape the card draws from, every store a
container runs answering a window of its own with the fields the lines need,
both kinds at once on a two-store container; and one assertion in
tests/e2e/admin.spec.ts on the two lines, which the gate runs on SQLite
alone and again with both stores.
Before and after, from both sites. The Timing card on 1.0.0.100, at
08:15 CDT on 2026-09-09, on the live site and on the second site: one store's
line, and on the second site that line is about the store not serving the
visit:
The same card on 1.0.0.101, at 08:47 CDT, both sites: the window sentence
names all three rings, and the document store has its line under the SQL
line with the request units and the fan-out count beside the percentiles: